

Every student pilot remembers the first time an instructor unfolded a sectional chart across the table. It looks like someone spilled a box of crayons over a road atlas: green lowlands fading into brown mountains, blue and magenta circles stacked like wedding cakes, tiny numbers everywhere, and a few big ones that seem to shout. Then, one lesson at a time, the noise turns into a language.
A sectional chart, or simply a “sectional,” is the standard map for flying by sight in the United States. Learn to read one and you can plan a cross-country flight, stay clear of busy airspace, avoid radio towers and pick the visual checkpoints that tell you exactly where you are. This guide walks through how to read a sectional chart, symbol by symbol, using the FAA’s own Chart Users’ Guide.
Kurzinfo
- Was: Sectional aeronautical chart, the standard US chart for VFR flight
- Skala: 1:500,000, or 6.86 nautical miles per inch
- Updates: Every 56 days
- Terminal Area Charts: 1:250,000 detail around major airports
- MEF: Highest elevation in each 30 x 30 minute quadrant, rounded up to the next 100 ft
- Airport colours: Blue = control tower; magenta = no tower
- Obstacles: Typically shown if more than 200 ft above ground (299 ft in city tint)
- Official key: FAA Aeronautical Chart Users’ Guide
What a sectional chart is, and why the scale matters
Sectionals are drawn at a scale of 1:500,000. According to the FAA, that works out at 6.86 nautical miles per inch, and the agency describes the series as designed for visual navigation of slow to medium speed aircraft. Each chart is named after a major city in its coverage area: Anchorage, Chicago, Los Angeles, New York and so on.
Around the biggest airports, the FAA also publishes Terminal Area Charts (TACs) at 1:250,000, twice the detail, because the airspace there is too crowded to read at sectional scale. And because the world below keeps changing, with new towers, new airspace and new frequencies, sectionals are updated every 56 days. An out-of-date chart is not a souvenir. It is a hazard.
The front of each chart carries the map; the legend explains every symbol. The FAA’s Aeronautical Chart Users’ Guide expands on that legend, and it is the best free textbook a student pilot can have.
FLY8MA.com flight training’s introduction to reading a VFR sectional chart.
Reading the ground: colours, contours and the big numbers
Start with the terrain, because the ground is the one thing you must never hit. Sectionals use five techniques to show it: contour lines, shaded relief, colour tints, obstruction symbols and Maximum Elevation Figures. Basic contours are spaced at 500-foot intervals, and closely spaced lines mean steep slopes. The tints run from light green for low ground to dark brown for high ground.
Here is a small “aha”: the shaded relief is drawn as if the sun were shining from the northwest. The FAA says that is because our visual perception has been conditioned to that view, so the mountains pop out of the paper the way your eye expects.
Now the big numbers. Scattered across the chart in large type, one per grid square, are the Maximum Elevation Figures, or MEFs. Each represents the highest elevation within a quadrant bounded by 30 minutes of latitude and 30 minutes of longitude, including terrain and obstacles such as towers and trees. MEFs are rounded up to the nearest 100 feet and shown with the last two digits dropped, with the hundreds as a smaller number. A large 13 followed by a small 5, as on the Anchorage sectional east of the city, means 13,500 feet.
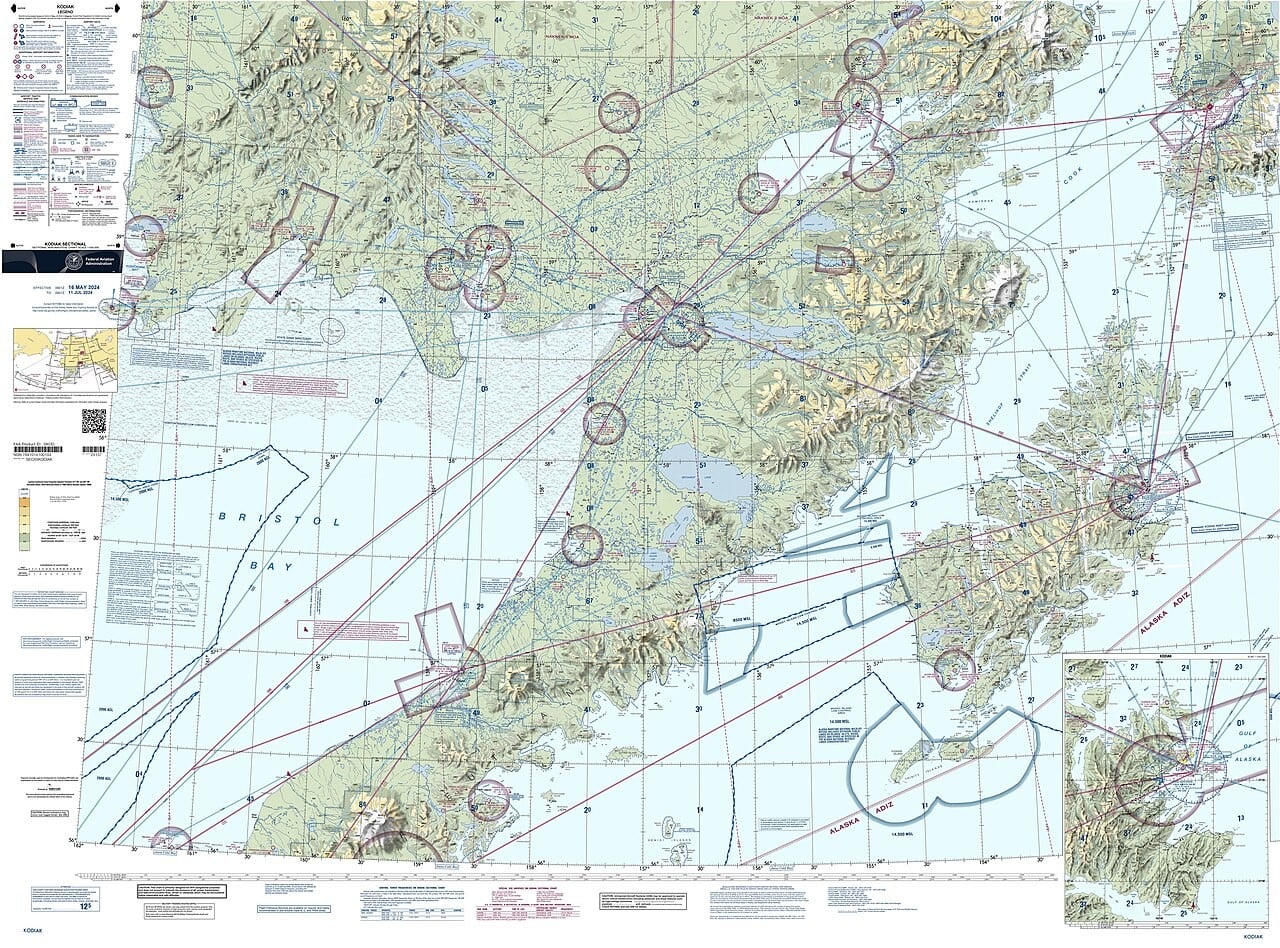
If you are flying in a quadrant, staying above its MEF keeps you above everything the FAA knows about in that box. But the FAA itself attaches a warning to those numbers.
Towers, wind farms and the obstacles you cannot see
Man-made obstacles get their own symbols. Sectionals typically show obstacles more than 200 feet above ground level, or more than 299 feet inside the yellow tint of a city. Next to each one are two numbers: the height of its top above mean sea level, and below it in parentheses the height above the ground. The first is what matters to your altimeter; the second tells you how tall the thing actually is.
Obstacles that are still being built carry the letters UC, for “under construction.” Wind farms appear as a hatched area with a dotted outline and a boxed elevation for the highest turbine. The Chart Users’ Guide adds a detail every low-flying pilot should memorise.
A private pilot ground lesson from Free Pilot Training on reading the airport symbols and data on a VFR sectional.
Airports: why some are blue and some are magenta
Airport symbols tell you a surprising amount at a glance. Airports with a control tower, and all their data, are printed in blue. Every other airport is printed in magenta. So before you even read the name, you know whether you will be talking to a tower or announcing yourself on a common frequency.
The symbol itself describes the runways. A filled circle with a runway sketched inside means hard-surfaced runways between 1,500 and 8,069 feet long; longer runways are drawn as the runway layout itself; an open circle means no hard-surfaced runway. Small tick marks around the circle mean fuel is available. A star on top marks a rotating beacon that operates from dusk to dawn.
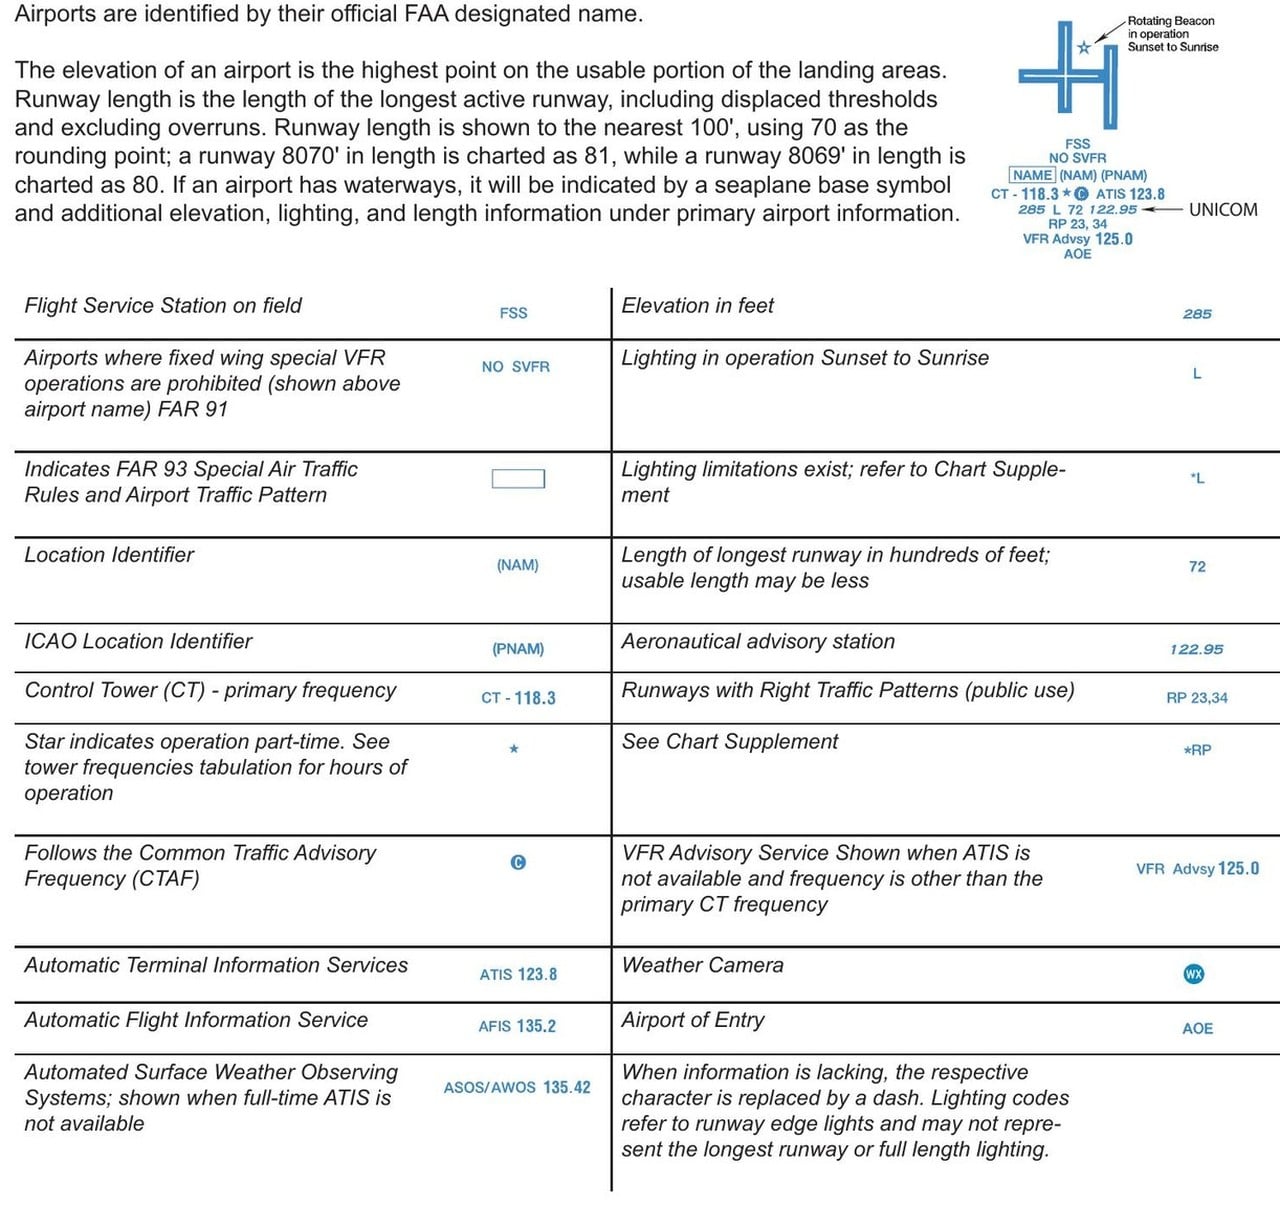
Next to the symbol sits the airport data block. Read it line by line: the name and identifier; the tower frequency after “CT”; a C in a circle that marks the Common Traffic Advisory Frequency; then the elevation in feet, an L if the runway lights are on from sunset to sunrise, and the longest runway in hundreds of feet. A 72 means 7,200 feet. The FAA notes that the usable length may be less, so the Chart Supplement still gets the final word.
Airspace: the wedding cakes decoded
This is where most students stare hardest. The FAA chart symbology works like this. Class B, around the busiest airports, is outlined in solid blue, with each sector labelled by two blue numbers in hundreds of feet. A 90 over a 20 means the sector runs from 2,000 to 9,000 feet above mean sea level. Class C uses the same idea in solid magenta, often a 70 over a 15 or similar. A “T” as a ceiling means up to, but not including, the Class B above.
Class D, around smaller towered airports, is drawn with a blue dashed line, and its ceiling appears in a little dashed box: a 30 means 3,000 feet. A minus sign in front of the number means “up to, but not including.” Class E that starts at the surface is a magenta dashed line. Class E starts at 1,200 feet above the ground unless designated otherwise, and fuzzy bands of colour, called vignettes, show where that changes: a magenta vignette marks a 700-foot floor.
Pilot Institute explains US airspace classes and how they appear on the charts.
Class A, from 18,000 feet up to FL600, is not drawn on visual charts at all, because no VFR pilot should be up there. Special use airspace is shown too: prohibited, restricted and warning areas in blue, military operations areas and alert areas in magenta, each labelled with altitudes, times of use and the controlling agency.
Putting it together on a cross-country
Once the symbols make sense, the sectional becomes a planning tool. You draw a line from departure to destination, read the course against a VOR compass rose or a meridian, and correct for magnetic variation using the dashed isogonic lines, which the FAA bases on its five-year magnetic variation model. Along the line you pick checkpoints: a lake, a highway interchange, a stadium, marked on the chart with a small black square.
Then you check what the line crosses: the MEFs, the towers, the blue and magenta airspace and any restricted areas. Those are the same skills behind pilotage and dead reckoning, covered on Afterburner in Dead Reckoning, LORAN and INS: How Pilots Fly Without GPS. Tablets and moving maps now overlay the same data, but they are drawn from the same chart, and reading it yourself is what keeps you ahead of the screen.
That first unfolded sectional never really looks like spilled crayons again. It looks like a promise: every line, colour and number is someone at the FAA telling you exactly what the world will look like through the windscreen, if you know how to listen.
Sources: FAA Aeronautical Chart Users’ Guide (July 2026 edition), FAA Sectional Aeronautical Chart product page, AOPA Flight Training
Header photo: FAA Anchorage Sectional (2024 cutout) / Wikimedia Commons, public domain



0 Comments