

In 2025 the world spent $2,887 billion on its armed forces. That is the highest figure SIPRI has ever recorded, the eleventh consecutive annual increase, and it works out at $352 for every person alive.
Below is what that money bought, counted as carefully as open sources allow: aircraft, ships, submarines, carriers and people, country by country.
Two warnings before the tables. First, every number here is an estimate from a named source with a stated date — they are not interchangeable, and mixing editions produces nonsense. Second, and more importantly, the definitions do more work than the numbers. A “destroyer” is whatever a navy decides to call a destroyer. Whether a country has 291 warships or 461 depends entirely on which rulebook you open. We have flagged those traps as we go, because they are where almost every viral military comparison falls apart.
Informations clés
| World military spending, 2025 | $2,887 billion (current 2025 US$) — up 2.9% in real terms |
| World military burden | 2.5% of global GDP — the highest since 2009 |
| Top spender | United States, $954bn — 33% of the world total |
| Active military aircraft worldwide | 52,231 across 161 nations (FlightGlobal/Cirium, 1 Oct 2025 data) |
| Largest air fleet | United States, 13,033 aircraft — 25% of the global total |
| Fixed-wing aircraft carriers | 20 hulls, operated by just six countries |
| Largest navy by hull count | China (PLAN), over 370 battle-force ships |
| Largest army | China (PLA), about 2.0 million active personnel |
| Principal sources | SIPRI (April 2026), FlightGlobal World Air Forces 2026, US CRS, US DoD, IISS, CSIS |
Part One: The Money
Spending is the cleanest of all these measures, because SIPRI has been doing it consistently since 1949 and publishes its methodology. It is also the best single predictor of everything else on this page, with a lag of about a decade.
Top 15 military spenders, 2025
Spending in current 2025 US dollars. Changes in real terms (constant 2024 US$). Square brackets denote a SIPRI estimate.
| Pays | Spending | Share of world | % of GDP | Change on 2024 | Change since 2016 | Per capita |
|---|---|---|---|---|---|---|
| 1. United States | $954bn | 33% | 3.1% | −7.5% | +11% | $2,755 |
| 2. China | [$336bn] | [12%] | [1.7%] | +7.4% | +62% | $237 |
| 3. Russia | [$190bn] | [6.6%] | [7.5%] | +5.9% | +96% | $1,318 |
| 4. Germany | $114bn | 3.9% | 2.3% | +24% | +118% | $1,346 |
| 5. India | $92.1bn | 3.2% | 2.3% | +8.9% | +39% | $63 |
| 6. United Kingdom | $89.0bn | 3.1% | 2.4% | −2.0% | +32% | $1,283 |
| 7. Ukraine | [$84.1bn] | [2.9%] | [40%] | +20% | +1,501% | $2,197 |
| 8. Saudi Arabia | [$83.2bn] | [2.9%] | [6.5%] | +1.4% | +12% | $2,428 |
| 9. France | $68.0bn | 2.4% | 2.0% | +1.5% | +21% | $1,021 |
| 10. Japan | $62.2bn | 2.2% | 1.4% | +9.7% | +61% | $504 |
| 11. Israel | $48.3bn | 1.7% | 7.8% | −4.9% | +120% | $5,108 |
| 12. Italy | $48.1bn | 1.7% | 1.9% | +20% | +57% | $813 |
| 13. South Korea | $47.8bn | 1.7% | 2.6% | +2.6% | +30% | $924 |
| 14. Poland | $46.8bn | 1.6% | 4.5% | +23% | +207% | $1,219 |
| 15. Spain | $40.2bn | 1.4% | 2.1% | +50% | +122% | $839 |
| World | $2,887bn | 100% | 2.5% | +2.9% | +41% | $352 |
Source: SIPRI Fact Sheet, Trends in World Military Expenditure 2025, published 27 April 2026. The top five account for 58% of world spending; the top fifteen for 80%.
Who spends the most, 2025
Military expenditure, US$ billion. The United States alone outspends the next seven countries combined.
SIPRI, April 2026. Current 2025 US$.
Burden, Not Just Bulk
Absolute spending flatters large economies. Military burden — spending as a share of GDP — shows how much a country is actually straining.
Military burden: spending as a share of GDP, 2025
The picture inverts almost completely. Ukraine is spending nearly half its economy on survival.
SIPRI, April 2026. World average: 2.5%.
Ukraine has now spent four consecutive years with the highest military burden on earth — 40 per cent of GDP and 63 per cent of all government spending. Russia’s military share of government spending reached 20 per cent in 2025, the highest SIPRI has ever recorded for the country.
The Long View: 1, 5, 10 and 20 Years
A single year tells you very little. Trends tell you what a country has decided about the next decade.
Real-terms change in military spending, top 10 spenders
Percentage change in constant 2024 US dollars over each period, ending 2025.
| Pays | 1 year | 5 years | 10 years | 20 years |
|---|---|---|---|---|
| États-Unis | −7.5% | −1.5% | +11% | +8.5% |
| Chine | +7.4% | +31% | +62% | +349% |
| Russie | +5.9% | +136% | +96% | +347% |
| Germany | +24% | +77% | +118% | +136% |
| India | +8.9% | +16% | +39% | +123% |
| United Kingdom | −2.0% | +24% | +32% | +21% |
| Ukraine | +20% | +969% | +1,501% | +2,729% |
| Saudi Arabia | +1.4% | +15% | +12% | +83% |
| France | +1.5% | +11% | +21% | +22% |
| Japan | +9.7% | +51% | +61% | +62% |
The 1-year and 10-year figures are published by SIPRI. The 5-year and 20-year columns are calculated from SIPRI’s own constant-2024-dollar series; the same method reproduces SIPRI’s published figures exactly. Note that 2020 is a COVID-distorted base year and Russia’s 2020 figure was a pre-invasion trough, so the 5-year column is base-sensitive.
Twenty-year growth, 2005 to 2025
Real-terms change. Ukraine is excluded from the scale — at +2,729% it would flatten everything else.
SIPRI constant 2024 US$. Ukraine: +2,729%.
That last line is the whole story of the century so far. Chinese and Russian spending have both grown roughly 350 per cent in twenty years. American spending has grown 8.5 per cent. The United States still spends more than the next seven countries combined, but the gap has been closing for two decades, and 2025 was the first year in some time that Washington’s spending actually fell.
NATO Versus Everyone
Alliance arithmetic changes the picture completely. NATO’s 32 members between them spent $1,581 billion in 2025 — 55 per cent of all military spending on earth.
The blocs, 2025
Current 2025 US dollars, on SIPRI’s methodology.
| Bloc | Spending | Share of world | Ratio vs Russia |
|---|---|---|---|
| NATO (32 members) | $1,581bn | 55% | 8.3× |
| — of which United States | $954bn | 33% | 5.0× |
| — of which European members (29) | $559bn | 19% | 2.9× |
| Chine | $336bn | 12% | 1.8× |
| Russie | $190bn | 6.6% | — |
| Russia and China combined | $526bn | 18% | — |
NATO’s own accounting gives a higher figure — $1,630bn for 2025 — because it counts some items differently. SIPRI notes NATO estimated Canada’s 2025 spending $5.0bn higher without disclosing the scope of the additional spending. Ratios are our calculation.
European NATO spending rose faster in 2025 than in any year since 1953. Germany passed 2 per cent of GDP for the first time since 1990; Spain for the first time since 1994, with a 50 per cent single-year jump. Poland now carries the heaviest burden in the alliance at 4.5 per cent.
Part Two: Airpower
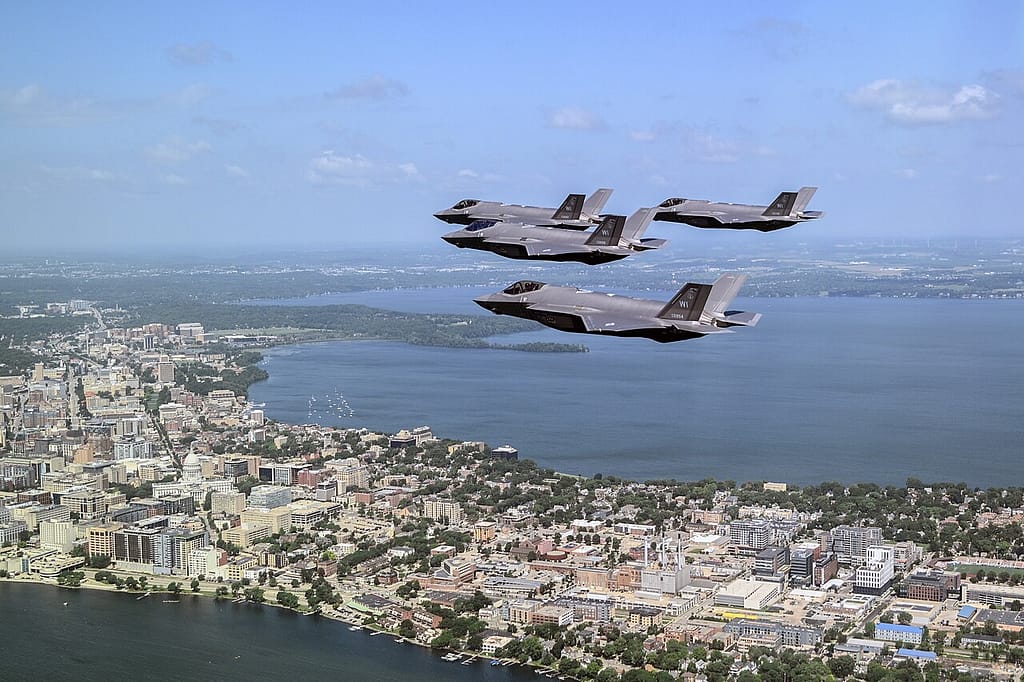
There are 52,231 active military aircraft in the world, spread across 161 nations. The number fell by 411 last year, mostly because the entire Syrian air force — 414 aircraft — was deleted from the count.
The twelve largest air arms, 2026
All services combined. Data drawn 1 October 2025.
| Pays | Total aircraft | Combat aircraft | Bombers | Pétroliers | Transports | Combat helicopters |
|---|---|---|---|---|---|---|
| 1. United States | 13,033 | 2,718 | 132 | 610 | 917 | 5,567 |
| 2. Russia | 4,237 | 1,559 | 115 | 18 | 458 | 1,535 |
| 3. China | 3,529 | 1,814 | 150 | 9 | 287 | 913 |
| 4. India | 2,183 | 600 | — | 6 | 277 | 894 |
| 5. South Korea | 1,540 | 340 | — | 4 | 40 | 786 |
| 6. Japan | 1,429 | 264 | — | 10 | 53 | 568 |
| 7. Pakistan | 1,397 | 421 | — | 4 | 63 | 319 |
| 8. Turkey | 1,101 | 201 | — | 7 | 84 | 481 |
| 9. Egypt | 1,088 | 332 | — | 0 | 53 | 348 |
| 10. France | 973 | 223 | — | 15 | 118 | 434 |
| 11. Saudi Arabia | 917 | 364 | — | 22 | 49 | 264 |
| 12. North Korea | 837 | 455 | — | 0 | 1 | 205 |
| (15.) United Kingdom | 625 | 141 | — | 9 | 30 | 215 |
Source: FlightGlobal World Air Forces 2026, data partner Cirium, published 13 November 2025. “Combat helicopters” is the report’s category for all non-training rotorcraft. The directory contains no uncrewed aircraft at all — any drone figure attributed to it is false.
Total military aircraft, 2026
The US fleet is larger than ranks two to six combined.
FlightGlobal World Air Forces 2026.
That tanker figure is the one professionals notice. Combat aircraft can be bought; the ability to move them across an ocean and keep them there cannot. Three quarters of the world’s aerial refuelling capacity belongs to one country, and it is the single clearest measure of who can actually fight far from home.
Bombers: A Club of Three
Only three countries operate strategic bombers. Everyone else’s long-range strike is done with fighters, cruise missiles or not at all.
Strategic bomber fleets, 2026
Active aircraft.
| Pays | Total | Composition |
|---|---|---|
| Chine | 150 | H-6 variants: 120 with the air force, 30 with naval aviation |
| États-Unis | 132 | 72 B-52H, 40 B-1B, 20 B-2. B-21 Raider: none active yet, 100 on order |
| Russie | 115 | 56 Tu-22M, 44 Tu-95, 15 Tu-160 |
FlightGlobal World Air Forces 2026. China now fields the largest bomber force by headcount, though the H-6 is a derivative of the 1950s Tu-16 and is not comparable to a B-2. FlightGlobal cautions that its Russian figures are likely higher than reality because airframe losses inside a conflict zone cannot be verified.
The Russian caveat matters. Ukraine’s June 2025 drone raid on Russian airbases reportedly destroyed around a fifth of Moscow’s operational strategic bombers on the ground — aircraft that no longer exist but which still appear in inventories.
The Chinese Number That Jumped
China’s combat fleet rose 14.6 per cent in a single edition, from 1,583 to 1,814. Almost none of that was new construction. It was a counting revision.
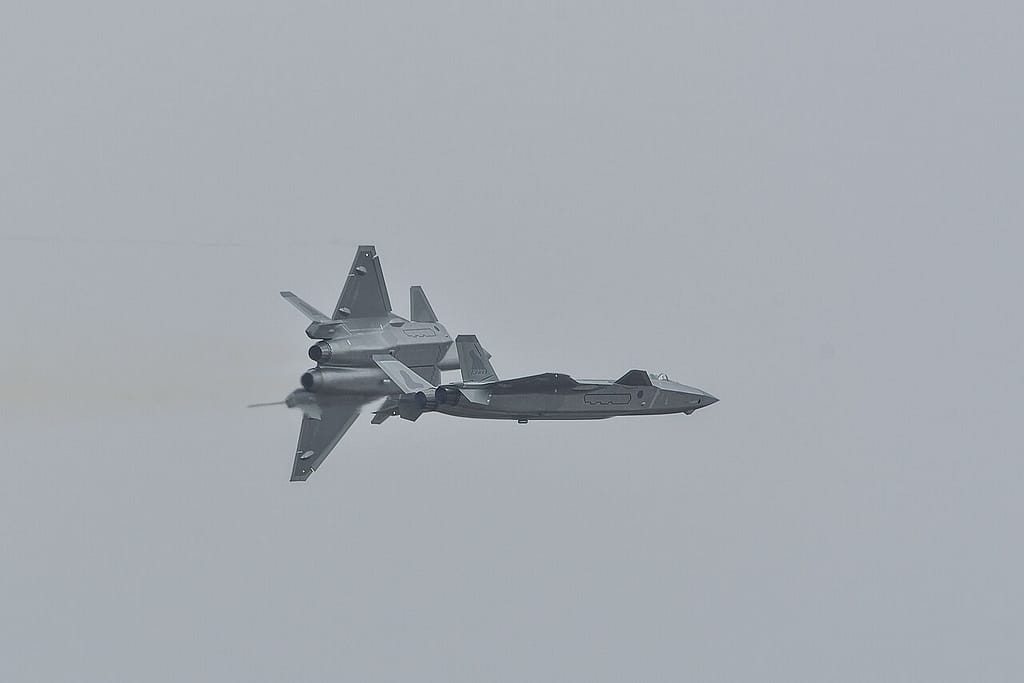
China is now building somewhere between 220 and 280 new fighters a year, on independent estimates. And the total above still excludes the Shenyang J-35 entirely — so the real figure is higher than 3,529.
There is a matching caution on the Russian side, in the opposite direction. FlightGlobal counts 1,559 Russian combat aircraft. Justin Bronk of RUSI, counting only genuinely serviceable modern types and discounting stored MiG-29, Su-24 and Su-25 airframes, arrives at roughly 545 to 560 fighters plus the bombers — a gap of about 2.4 times. Both numbers are defensible. They are answering different questions.
Fifth Generation: Roughly 1,300 Aircraft, Very Unevenly Spread
Raw fleet totals hide the thing that actually decides a modern air battle. Of the 52,231 military aircraft in the world, only around 1,300 are fifth-generation stealth fighters — about 2.5 per cent of the total, and they are distributed more unequally than any other category on this page.
A definitional note first, because this label is abused more than any other in aviation. We count the F-22, the F-35, the J-20, the J-35 and — with reservations explained below — the Su-57. Aircraft still in development, such as Turkey’s KAAN and South Korea’s KF-21, are not counted. Nor are 4.5-generation types like the F-15EX, Rafale or late-tranche Typhoon, which are in several respects more capable than the Su-57 despite the generational label.
Fifth-generation fighters in service, 2026
Operational aircraft. The United States and China are the only countries operating two different fifth-generation types.
| Pays | Fifth-gen aircraft | Types operated | Notes |
|---|---|---|---|
| 1. United States | 620+ | F-22 Raptor, F-35A/B/C | 183 F-22 airframes remain of 187 built; the rest are F-35s across the Air Force, Navy and Marine Corps |
| 2. China | 300+ | J-20, J-35 | Estimates range from about 250 to over 500. Neither type is exported |
| 3. Australia | 72 | F-35A | Operated alongside Super Hornets and Growlers |
| 4. Norway | 52 | F-35A | One of only two air forces to have transitioned fully to the F-35 |
| 5. Netherlands | 49 | F-35A | Fully transitioned. A Dutch F-35 scored a drone kill over Poland in 2025 |
| 6. Israel | 46 | F-35I “Adir” | A uniquely customised F-35A with Israeli systems |
| 7. Japan | 46 | F-35A (43), F-35B (3) | The F-35Bs are flown by the Air Self-Defense Force, not the Navy |
| 8. South Korea | 40 | F-35A | Separate from the domestic KF-21 programme |
| 9. United Kingdom | 38 | F-35B | Joint RAF and Royal Navy Lightning Force, flown from both carriers |
| 10. Italy | 38 | F-35A (32), F-35B (6) | F-35Bs operate from the carrier Cavour |
| 11. Russia | ~20 | Su-57 | Roughly 19 in service at the end of 2024, about six delivered that year |
| World | ~1,300 | — | More than 1,300 F-35s of all variants have now been delivered across 17-plus nations |
Compiled from FlightGlobal World Air Forces, WDMMA and national defence ministries, October 2025, with Lockheed Martin delivery figures to March 2026. Figures for China and Russia are estimates and the spread between sources is wide.
Fifth-generation fighters by operator
Approximate aircraft in service. The eleventh-placed operator is Russia.
The United States operates roughly half of all fifth-generation aircraft in existence.
The Line That Puts It in Perspective
Read the table again and note where Russia sits. The Netherlands — a country of 18 million people with a single fighter type — fields more fifth-generation aircraft than the Russian Federation.
Russia’s difficulty is not design ambition but production. Sanctions have kept some of the Su-57’s advertised systems out of the aircraft entirely, and serial deliveries have run at single digits a year. Algeria is expected to become the first export customer, with a reported order for twelve.
The opposite problem exists in the two categories nobody exports. The F-22 line closed in 2011 after 187 aircraft, and the United States has never sold one abroad. China applies the same ban to the J-20. Both countries keep their best air-superiority aircraft for themselves and export the multirole one — the F-35 for America, and probably the J-35 for China, which is openly touted for export.
Which leaves one asymmetry that matters more than any individual airframe. The F-35 has been ordered by around twenty countries. Every one of those fleets is interoperable, shares a common logistics chain, and can pass targeting data to the others. China’s stealth fleet is larger than anyone’s but Washington’s, and it flies alone.
The counting caveat applies here too, as it does everywhere on this page. FlightGlobal’s directory records 177 active F-22s and 883 F-35s worldwide, because it excludes aircraft in storage or undergoing upgrade. Lockheed Martin has delivered more than 1,300. Both numbers are correct; they answer different questions.
Part Three: Navies
This is where counting becomes genuinely treacherous, and where most published comparisons are simply wrong.
Aircraft Carriers: Six Countries, Twenty Ships
Aircraft carriers in service, August 2026
Fixed-wing carriers only. Helicopter carriers listed separately below.
| Pays | CATOBAR | STOBAR | STOVL | Total | Notes |
|---|---|---|---|---|---|
| États-Unis | 11 | — | — | 11 | 10 Nimitz-class plus USS Gerald R. Ford |
| Chine | 1 | 2 | — | 3 | Fujian commissioned 5 Nov 2025 — first non-US ship with electromagnetic catapults |
| India | — | 2 | — | 2 | Vikramaditya and the domestically built Vikrant |
| United Kingdom | — | — | 2 | 2 | Queen Elizabeth and Prince of Wales, 65,000 t each |
| France | 1 | — | — | 1 | Charles de Gaulle, 42,000 t, nuclear |
| Italy | — | — | 1 | 1 | Cavour; the LHD Trieste is not yet F-35B qualified |
| Russie | — | (1) | — | 0 | Admiral Kuznetsov laid up, refit suspended, has not sailed since 2017 |
| World | 13 | 4 | 3 | 20 | Add Spain’s Harrier-carrying Juan Carlos I and nine US F-35B-capable amphibious ships and the total is about 30 |
Compiled from USNI News, Naval News, navy.mil and national navies, August 2026.

A fourth Chinese carrier is under construction at Dalian. Satellite imagery from May 2026 shows a hull about 286 metres long with two large compartments carrying the hallmarks of shielded reactor containment.
The Pentagon’s stated expectation, published in December 2025: the PLAN aims to produce six carriers by 2035, for a total of nine.
The carriers currently under construction around the world, including China’s Type 004 and France’s nuclear-powered replacement for the Charles de Gaulle.
Every aircraft carrier in service in 2026, country by country.
Warships: The 291-or-461 Problem
Ask how many ships the US Navy has and the honest answer is another question: counted how?
The US counting rule is a Navy instruction, not a law. It admits commissioned warships and certain support vessels, and excludes patrol craft, unmanned vessels, tugs, barges, hospital ships and most sealift. On that rule the US Navy had 293 battle-force ships in October 2025. Count every hull of every kind and the same navy is 461.
The same trap applies to the famous China comparison. The Pentagon’s last published figure had the PLAN at over 370 battle-force ships against the US Navy’s 291 — and contrary to a widespread claim, that Chinese figure explicitly excludes around 60 missile-armed patrol catamarans. It is not padded with speedboats.
Worth noting for anyone quoting the Pentagon: the December 2025 edition of the China Military Power Report dropped the battle-force number entirely. The last published figure dates from the 2024 edition.
Major fleets by hull count
Commissioned or in service. “Destroyer” means whatever the country itself calls one — see the warning below.
| Navy | Carriers / big decks | Croisières | Destroyers | Frégates | Submarines | Fleet total |
|---|---|---|---|---|---|---|
| États-Unis | 11 CVN + 9 LHA/LHD | 7 | 77 | 0 | 65 (14 SSBN, 47 SSN, 4 SSGN) | 293 battle force |
| China (PLAN) | 3 CV + 4 LHD | 10 (Type 055) | 52 | 54 | 66+ (6 SSBN, 12–14 SSN, 48+ SSK) | over 370 |
| Russie | 1 (non-operational) | 4 | 8–12 | 12 | 54–72 | ~290 incl. reserve |
| India | 2 CV | 0 | 13 | 20 | 19 (3 SSBN, 16 SSK) | ~145 combatants |
| Japan | 2 CVM + 2 DDH | 0 (2 from 2027) | 36 | 16 | 23 | 155 vessels |
| Corée du Sud | 2 LPH | 0 | 13 | 15 | 21 | 262 (2022 figure) |
| United Kingdom | 2 CV | 0 | 6 | 7 | 10 (4 SSBN, 6 SSN) | ~63 in service |
| France | 1 CVN + 3 LHD | 0 | 0 | 15 nominal / 10 first-rank | 7–10 | not published |
| Australia | 2 LHD | 0 | 3 | 7 | 6 | 32 commissioned |
| Germany | 0 | 0 | 0 (none since 2003) | 11 | 6 | ~65 (2022 figure) |
Compiled from CRS, US DoD, USNI News, Naval News, national navies and IISS, 2025–26. The US has zero frigates: the Constellation class was cancelled in November 2025.
Why “Destroyer” Means Nothing
The column above is close to meaningless without this warning, so here it is plainly. Ship classes are national branding decisions, not engineering categories.
China’s Type 055 displaces 12,000 to 13,000 tonnes. The Pentagon calls it a cruiser; China calls it a destroyer. China’s “cruiser” count in American tables jumped from zero to eight purely because of US naming convention.
Germany has not rated a ship as a destroyer since 2003 — as deliberate policy, to symbolically underline military restraint — despite operating 7,000-tonne frigates. France and Italy operate the identical Horizon-class hull with the identical missile system: France calls it a frigate, Italy calls it a destroyer. Britain’s Type 26 frigate outweighs its Type 45 destroyer. Italy’s 6,000-tonne, 16-cell PPA is officially an offshore patrol vessel; Indonesia bought two and commissioned them as frigates. Iran calls 1,500-tonne ships destroyers; US naval intelligence classifies them as corvettes.
Compare hull counts across navies without reading the definitions and you are comparing marketing departments.
Tonnage, Missile Cells and the Better Questions
Because hull counts are so unreliable, analysts prefer tonnage. Here honesty requires an admission: no current aggregate tonnage figure for either navy exists from an authoritative public source. The comparison everyone repeats rests on a 2018 Brookings estimate — the US Navy at roughly twice China’s tonnage, a gap of about three million tons — and a 2024 CSIS study. Anyone quoting a 2026 tonnage figure is inventing it.
What CSIS did establish in 2024 is more interesting than the raw number.
Better metrics exist. Vertical launch cells — the actual magazine depth of a fleet — put the US Navy at around 9,900 against the PLAN’s 4,200. That still sounds comfortable until you see the trend: in 2004 the ratio was 222 to one.
Measures that matter more than hull count
2024 data unless stated.
| Measure | États-Unis | Chine |
|---|---|---|
| Warships over 1,000 t, missile or torpedo armed | 219 | 234 |
| Vertical launch cells | ~9,900 | ~4,200 |
| Nuclear-powered submarines | 66 | 12 |
| Submarine VLS cells | 1,168 | none confirmed |
| Share of fleet launched after 2010 | ~25% | ~70% |
| Support and auxiliary ships | 126 | 167 |
| Shipyard capacity (2023, ONI) | under 100,000 t | 23,250,000 t |
Sources: CSIS, Unpacking China’s Naval Buildup, June 2024; US Office of Naval Intelligence briefing slide, 2023. On auxiliaries and shipbuilding capacity China is ahead, which is the reverse of the usual framing.
That last line is the one that keeps American planners awake. The ONI slide put Chinese shipyard capacity at over 23 million tons against under 100,000 for the United States — a ratio of more than 230 to one. The US Navy confirmed the slide was genuine while cautioning it was drawn from public sources and was never meant as a deep analysis of Chinese commercial shipbuilding.
Carrier size compared — the United States, China and the United Kingdom side by side.
Part Four: People
Manpower has its own version of the definitions problem: authorised strength, funded billets and actual serving headcount are three different numbers, and countries quote whichever flatters them.
Active military personnel, top 15
Best estimate of actual serving strength, not authorised establishment.
| Pays | Active personnel | Année | Source |
|---|---|---|---|
| 1. China | 2,035,000 | 2024 | US DoD China Military Power Report |
| 2. India | 1,376,729 | 2024 | Indian MoD, in-position strength |
| 3. United States | 1,285,084 | 30 Sep 2025 | US Defense Manpower Data Center |
| 4. North Korea | 1,280,000 | 2022–26 | ROK MoD / IISS |
| 5. Russia | ~1,134,000 | 2025 | IISS Military Balance |
| 6. Ukraine | 800,000 | Dec 2025 | President Zelensky |
| 7. Pakistan | 660,000 | 2026 | IISS |
| 8. Iran | ~610,000 | 2025 | IISS |
| 9. Turkey | 494,500 | 2025 | NATO — but IISS gives 355,200 |
| 10. South Korea | ~450,000 | Jul 2025 | ROK MoD |
| 11. Vietnam | 450,000 | 2026 | IISS |
| 12. Egypt | 438,500 | 2026 | IISS |
| 13. Indonesia | 433,700 | 2026 | IISS |
| 14. Brazil | 376,000 | 2023 | IISS |
| 15. Thailand | 360,850 | 2026 | IISS — unchanged since 2023 |
Ranking is sensitive to source. On the NATO figure Turkey is 9th; on the IISS figure it falls to 16th, because Turkey’s Gendarmerie moved to the Interior Ministry in 2016.
Authorised versus actual: the recruitment gap
The four cases where the difference is largest.
| Pays | Authorised | Actually serving | Shortfall |
|---|---|---|---|
| Russie | 1,535,000 (decree, Aug 2026) | ~1,134,000 | ~400,000 |
| India | 1,495,645 sanctioned | 1,376,729 | 118,916 (8%) |
| Japan | 247,154 | 217,701 | 29,453 (12%) |
| États-Unis | 1,302,800 (FY2026 NDAA) | 1,285,084 | 17,716 (1.4%) |
Russia has raised its authorised end strength six times since 2022. Japan filled just 72% of its recruiting target in FY2025.
Demographics are quietly becoming the binding constraint. South Korea has gone from 563,000 active personnel in 2019 to about 450,000 in 2025, and projects 290,000 by 2030 — not through policy, but through birth rates. India loses around 60,000 people a year to attrition. The US Navy is roughly 20,000 sailors short at sea.
What None of These Numbers Tell You
Every table above measures inventory. War is decided by things inventories cannot capture, and it is worth being explicit about the gaps.
Readiness. FlightGlobal counts aircraft not recorded as in storage or undergoing upgrade. That is an accounting definition, not a statement that they can fly tomorrow. Of Russia’s nine Akula-class attack submarines, five are in refit and one is in reserve — leaving perhaps three available from a paper fleet of nine.
Munitions. Nobody publishes credible stockpile figures. A fleet of aircraft with two weeks of precision weapons is a two-week air force, and several NATO members discovered exactly this after 2022.
Logistics and training. Tankers, transports, spare parts and flying hours decide whether a force can be used. The tanker column is the closest proxy on this page, and it is brutally lopsided.
The counting problem cuts both ways. The most instructive example of 2026 came from the Gulf. After the campaign against Iran, US Central Command reported that a fleet which had eleven ships in the Gulf of Oman had none. Yet analysts assessed that 80 to 90 per cent of Iran’s small boats and minelaying craft survived — and those are the vessels that actually threaten shipping in the Strait of Hormuz. The ships that appeared in the tables were destroyed. The ships that never appeared in any table are the ones that still matter.
The Shape of It
Strip out the detail and four things are happening at once.
The United States retains an enormous, and in some categories overwhelming, lead — a quarter of the world’s military aircraft, three quarters of its tankers, eleven carriers, two thirds of the world’s nuclear submarines and a third of all military spending. That lead is real and it is not close to disappearing.
China is closing specific gaps very quickly, and has already passed the US on hull count, on warships over 1,000 tonnes, on fleet age, on auxiliaries and on shipbuilding capacity by a factor of over two hundred. Its 31st consecutive annual spending increase is the longest unbroken run in SIPRI’s entire database.
Europe is rearming faster than at any point since the early 1950s, from a very low base, and mostly by writing cheques rather than by fielding new units — the equipment those budgets buy will not arrive for years.
And the constraint everyone is running into is not money. It is people, shipyards and production lines. Japan cannot fill its ranks. Korea is shrinking by demography. The United States can fund carriers faster than it can build them. In that world, the twenty-year spending trend at the top of this article is a better guide to 2040 than any inventory table below it.
Sources: SIPRI, Trends in World Military Expenditure 2025 (April 2026) and the SIPRI Military Expenditure Database; FlightGlobal World Air Forces 2026 with data partner Cirium; US Congressional Research Service reports RL32665 and RL33153 by Ronald O’Rourke; US Department of Defense, Military and Security Developments Involving the People’s Republic of China (2024 and 2025 editions); CSIS, Unpacking China’s Naval Buildup (2024) and Hidden Reach (2026); RUSI; IISS Military Balance; US Naval Institute News; Naval News; NATO; national defence ministries.
A note on method: every figure carries its source and year. Where sources disagree, both are given rather than averaged. Where no authoritative figure exists — current fleet tonnage, most national drone inventories — we have said so instead of estimating.


0 commentaire